Common misconception - Cannot Draw Stacked Line Chart? -
This is a kind of common misconception accordin to my experience.
That is "We cannot draw stacked line chart."
I heard this comment from multiple people, even I did think so until recently.
The reason is, when I create simple charrt with dragging below three pills on the each field, Tableau automatically draws a chart as below.

One confusion at very begining as Tableau newby, is difference between Line Chart and Bar/Area Chart.
When we change the cahrt type to "Bar", the graph cahnged as below.
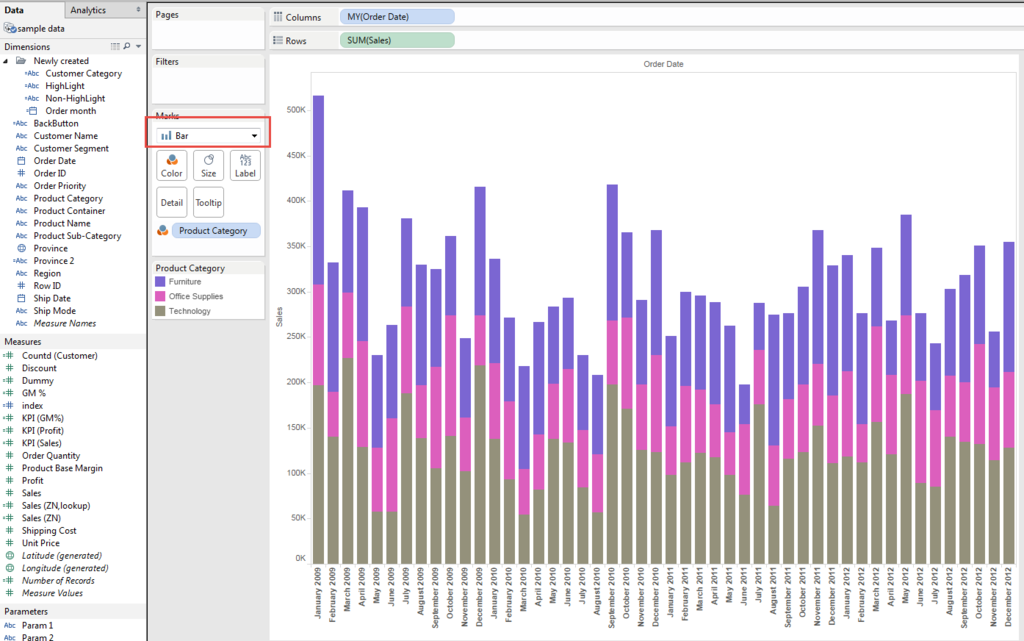
It's stacked.
Then change the type to "Area", it's also stacked.
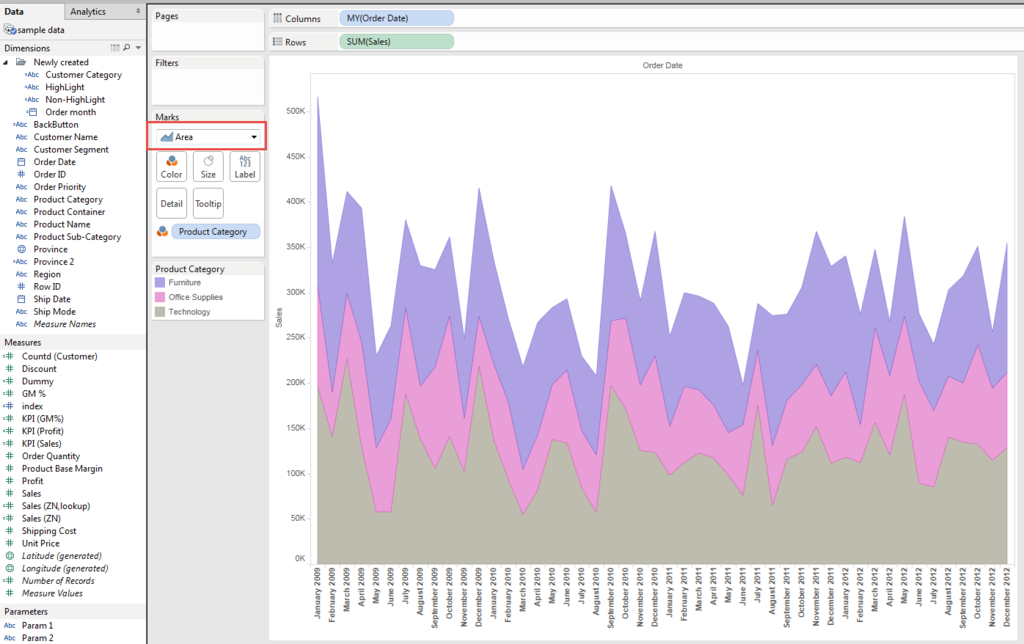
From this behavior, I missunderstood that Tableau cannot draw stacked line chart.
But that's not true.
Again, there is check/uncheck problem.
Go back to line chart, and go "Analysis" from menu bar.
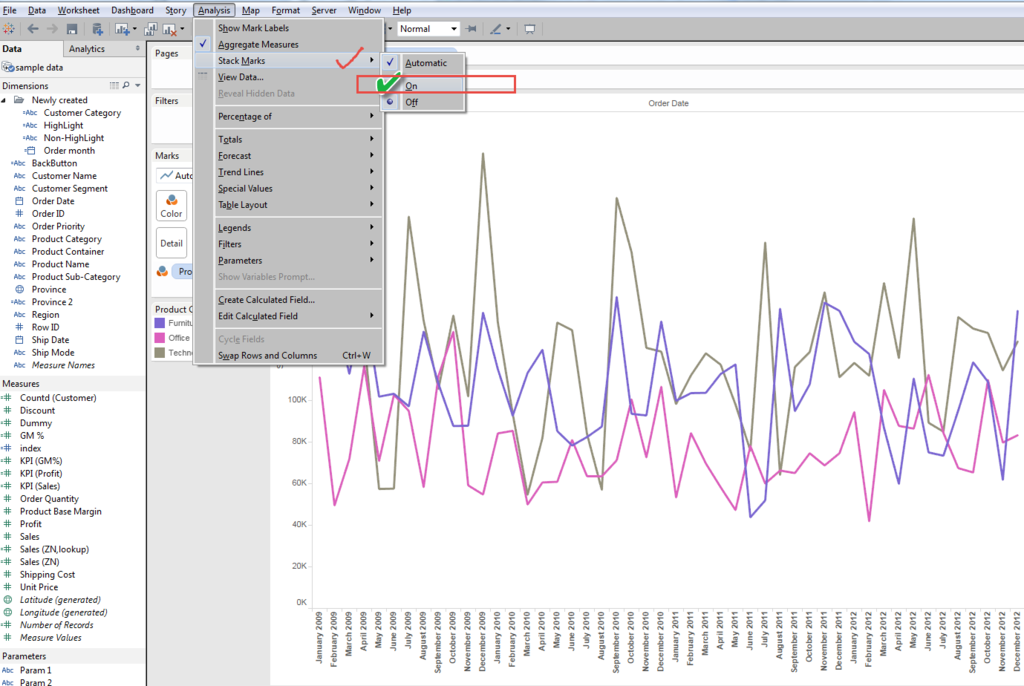
Then you can get stacked AREA Chart !!??
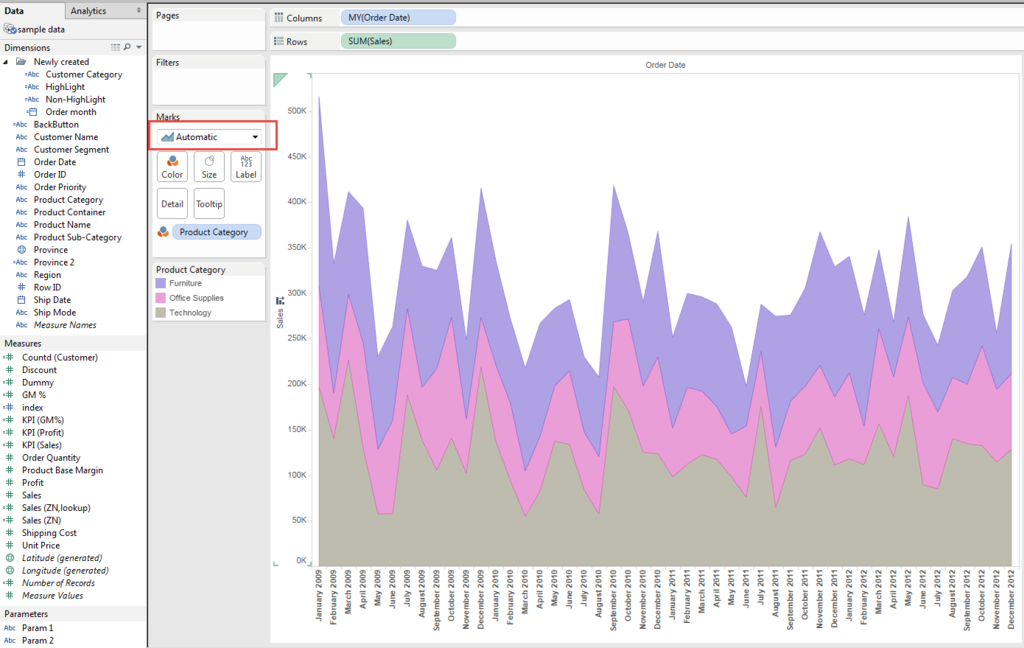
This was a second reason I thought that Tableau cannot draw Stached Line Chart.
But we can see the chart type shows "Automatic".
Now we change the type to "Line" again.
Finally we got stacked Line Chart.
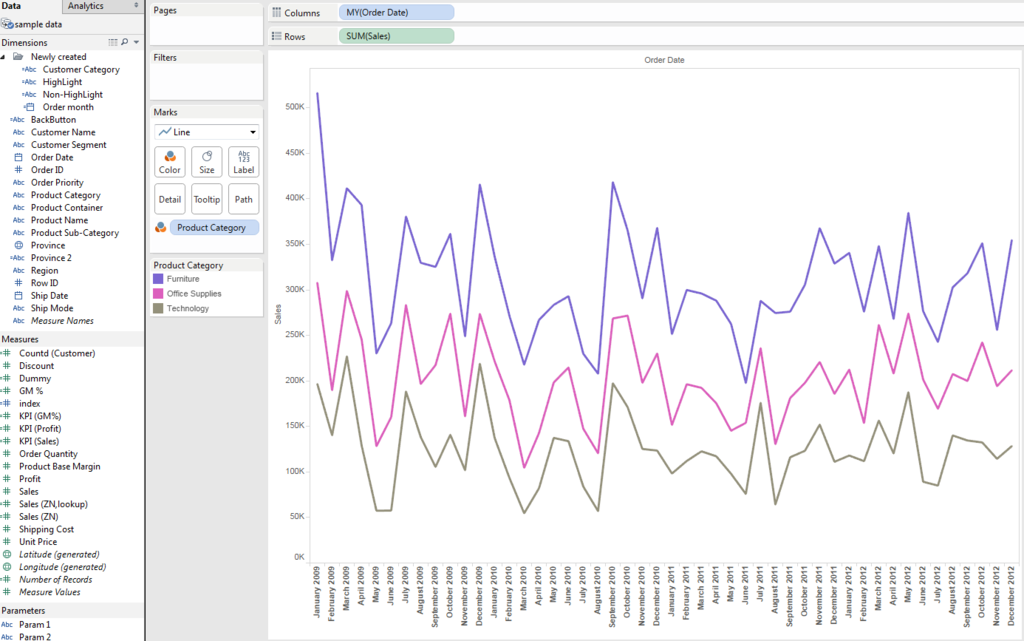
On the other hand, when we change the chart type to "Bar" and stack mark to "Off"
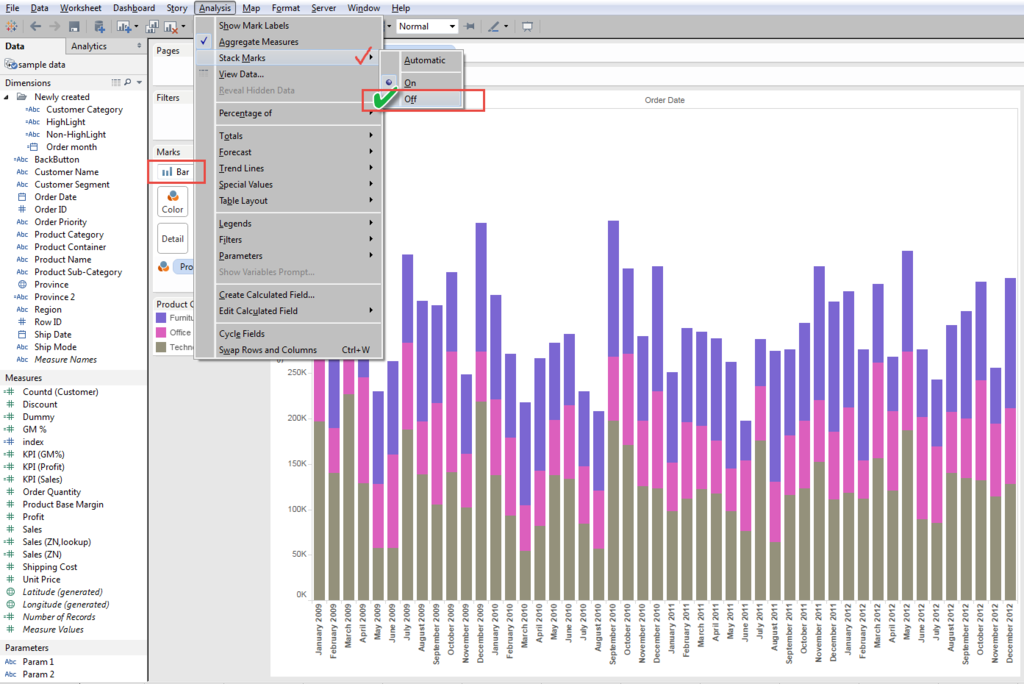
we got non-stacked Bar Chart.
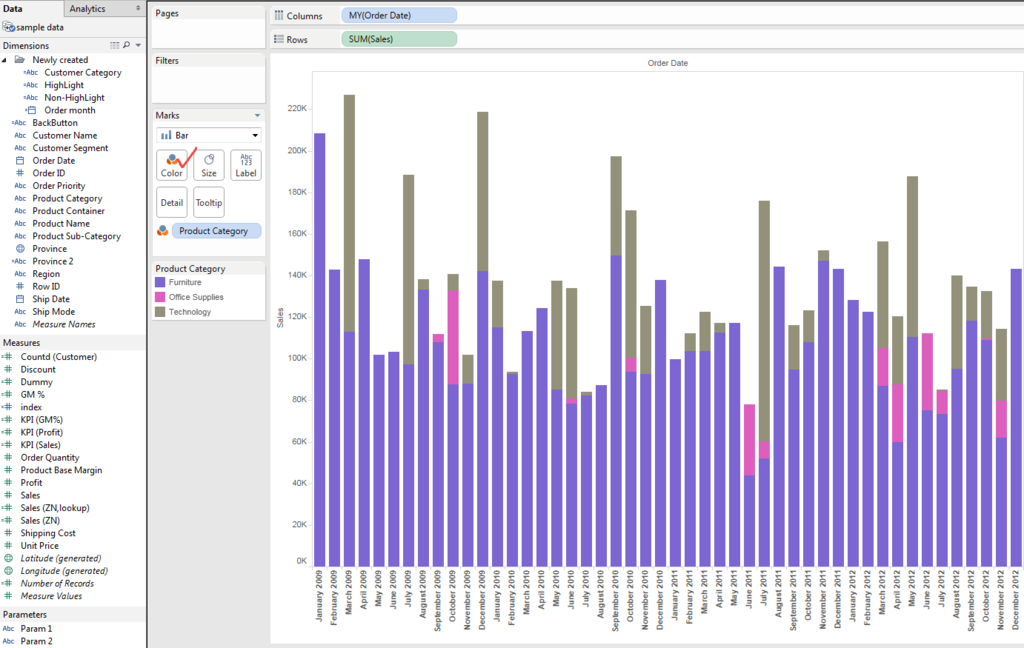
In this view, the color is overwrapped and does not make sense as a chart.
So, change the color transparency,
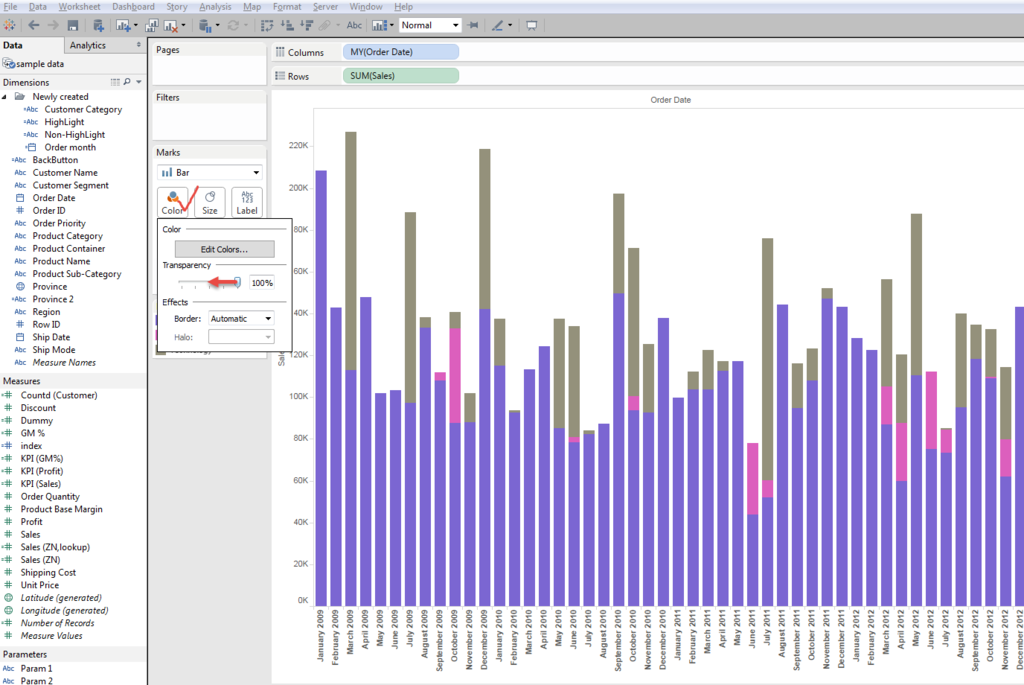
and got below view.
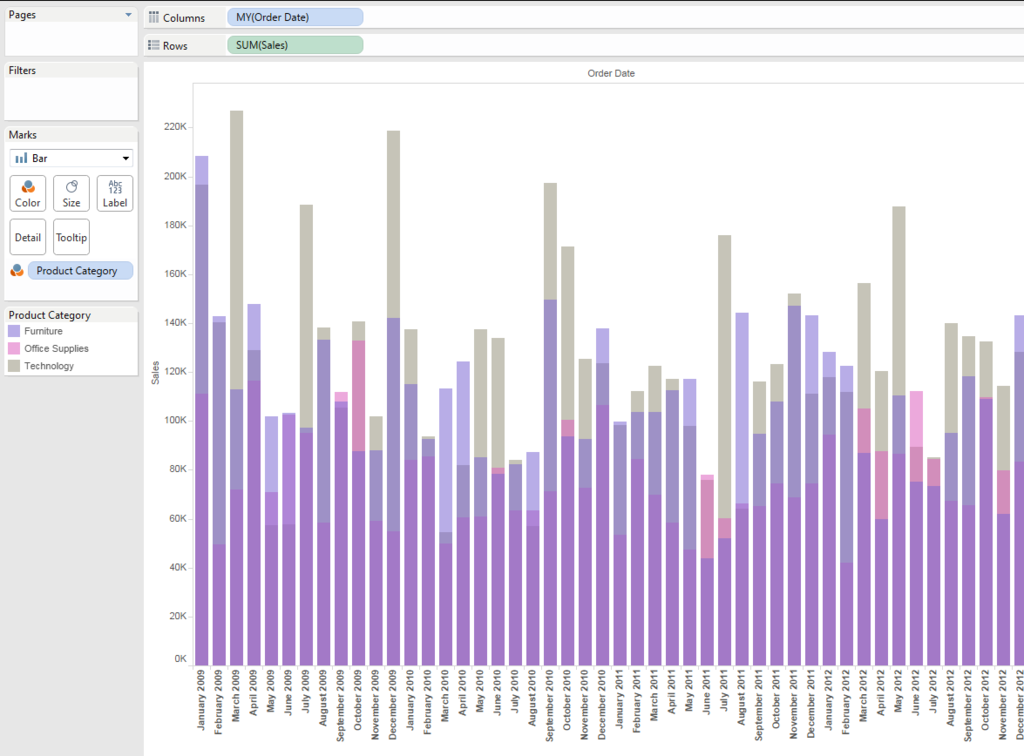
Also on this non-stacked bar chart, with changing the order of category in color shelf, we can change the order of layer of color.
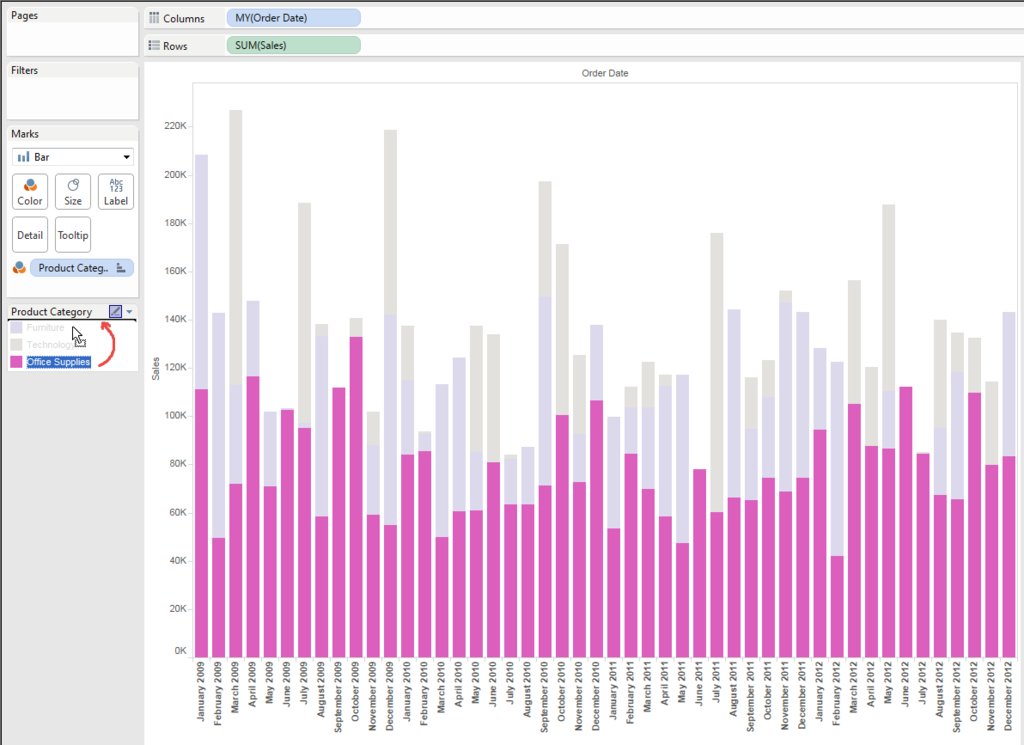
Like below.

Enjoy Tableau !!