Excel Cannot Achieve (probably) -- Show the difference from Previous Month.
i was asked by my friend. "Teach me the difference from Excel".
........
It's way different, anyway, try to explain with using very simple example.
We use same data which were posted the otehr day.
Tableau View:

Excle View:

To add lavel, already had problem which mean I needed to add 5 different lable for each.. I gave up to modify the number format x 5 times....
Plus, I could not find a way to add sum of each month on tpo of Bar chart, which we already done in Tableau last week.
Anyway, up to his point no significant difference.
Now we want to show the diference from last month. Let's do that in both softwares.


End Results by Excel

I don't know the way to show vertical ordered two graphs, but only horizontal ordered two graphs.
Tableau :


Concept is same as Excel Pivot.
Then drag to Rows.

End Results in Tableau.

Side by Side (Excel vs Tableau)

Further more,
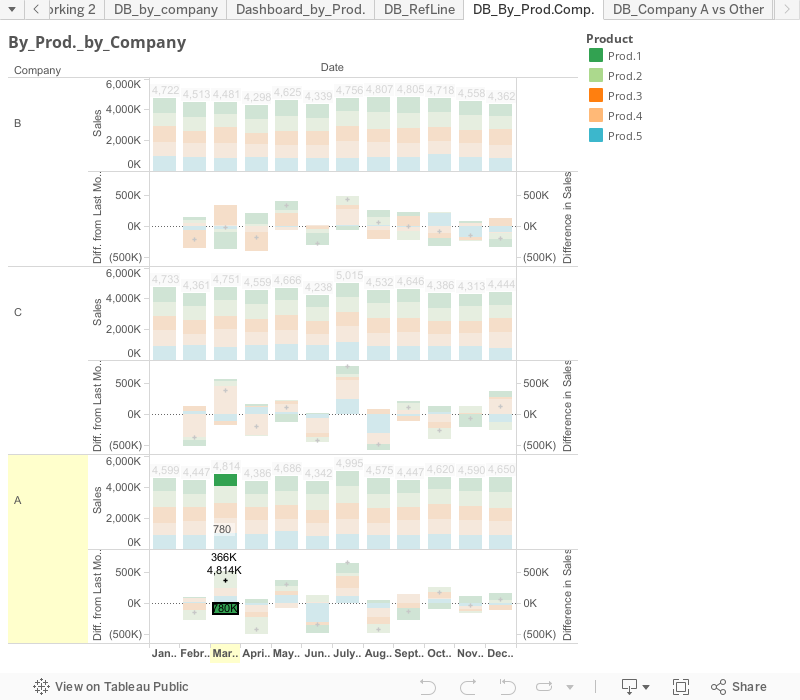
I tired to compare each company's difference from previous month.
I even don't want to create something with Excel for this request here....
It requres 3 company x 2 (standard, delta) graphs.....
On the other hadn with Tableau, just drag "Company" on Row.

Now you can get the Sales by month, diffdrence from previous by Company.
With same scale of "Y-axis" automatically.
(<== this is important for us, in the past in my company , we wasted time to discuss "BiG' delta of "Small" absolite value. But if you need to create indivicula chart independently. this is also pretty troublesome.)

You can find couple of highlights immediately from these charts.
Company A is pretty stable acroos products, but three data point have big delta.
Company B has big fructuation on Prod.3.
Company C has big fructuation on Prod.4.

Furtehrmore, with selecting "Prod.5"(or any other dimension) in color legend, you can highlight "Prod.5" in the graph.

Above is just one simple example we don't want to struggle with Escel any more, : )
And Tableau became Savior to me.
<<Link to workbook on Tableau Public>>
Let's play aruojnd and Enjoy!
Still keep Grand Total after Filtering
Modified yesterday's graph a little bit, now it shows by Product View.
Today's goal is to show "By product View" with Company Filtered.
But.... Need to keep G.Total of three company as reference.

Here is the end goal. You can understand the intent of this view.
We want to see Company A's each product's proportion out of G.Total of three compnaies.

Little bit tricky, but after you learn, it is easy. (That's no doubt)
Now we filter company A.
This looks good.
Tableau is KIND enough to automatically filter not only Bar cahrt, but also reference line......
Go back to the gooal, we need to keep reference ine of G.Total.
This is pretty difficult with normal method because Tableau's filter is very strong function and automatically afect to all VIZ.
Then, we need to put special direction of "Not to exclude".
Now we need to introduce nice guy who is one of most frequently used in Tableau's operations.
It's LOD (Level of Detail)
K, we put the caluculatioon field.
To explain LOD, I think I need more than 100 pages.. For now, I only focus on today's task.
[LOD_Sales]
{fixed[Date]:sum([Sales])}

{} is seen. This is the sign of LOD, and it is displayed in purple in calculaton window.
This means "Sum if [Date] matches, no need to consider other fields, please."
Now, let's put this calulated field into Deital, and add reference line just quick.


Wow, it's done, pretty fast today!, yeah.....
And that turned out as incorrect.
There was a trap again.
I love you, Tableau....
I unfilter company and select "All".
then chart cahnged as below.

Hey, it's x 3 now becasue we have three comapanies.
It took couple of hours to dfix this problem.
It's quite easy after I learn how. (Anything is so !!)

ALL
Filter "Company A"

Really done now.
I was safe with checking "All" before publishing, otherwise, I needed to asham myself. : )
Let's play around and enjoy !!
workbook(Tableau Public)
Display Sum on Top of Stacked Bar
Let's create a chart like this.

It's pretty nice view already, but typically I got additional request.
Which is "Can you add total value on top of Stack bar?"
Answer is Yes, then let's try.
1st, add calculated field.
[Total Sales]
total(sum([Sales]))
K, no error, seems right, put this fields into Label


mmm... Some things are not right....
First of all, sum for horizontal is not I want. I will correct this.


Looks reasonable.

It's changed, and number looks correct. That's good.
However, you see same number on each color... We don't need three of them...
Looks like we need to cahgne our approach.
K, here is a right/easier way.
Right click on Y-axis and select "Add Reference line"


You can see it now. The point is put Reference Line, but without "LIne".
Like this case, Add some function "with INVISIBLE feature" is one of the important "TIPs" in Tableau.
It does not show whole digit right now, then change the numebr format.


This is a final view.

Let's play aruojnd and Enjoy!
Easy! One click to set appropriate "Date" Format
Let's say I want to create this table

The initial view resulted in below.

Tableau's default is "year".

Try open "+" mark


Not good...

Mont honly displayed on the middle and cannot be seen.
Try "Exact Date" which brings original data's format.


Oh, Tableau says I did something wrong....

But it's still mid-process.
Chnge it to "Discrete"


Nop, it has "Time" information which I don't need now.
K, try next.


Finally done....
By shortest process,
Date ==> More ==> Custom ==> MDY ... Still troublesome.
Then, TIPS!! I'm afraid that nobody read through this part, anyway..
Drag "Date" field WITH PUSHING RIGHT SIDE OF MOUSE

Now you can select from the whole list.

Let's play around and Enjoy!
.
By shortest process,
You don't need to connect to datasource.
OK, 1st Tip.
This might be too easy and many people might say it's well-known. Anyways.
Secret Tips will be posted in the future. : )
Tableau can access to variety of data sources, which is very good.
H owever, when you are working on Excel, and assume you only want to see the graphical view just as reference, normal procedure becomes pretty long compared with your needs.
Save Excel=> Data Connection => serch the folder => select file => select sheet ....
So, in such a case, there is much eaiser way to replicate same data on Tabelau.
Picure instruction starts from "Normal Way". (Easer way is on the bottom)


I was tired only with copy and paste of picutures......
Yes, it's definitely troublesome.
So, here is easier way.


You should open Tableau new file BEFORE copy data from Excel.
You missed, you just copy the data on exce again.

Done.
Play around it by yourself, enjoy !
How did I get started using Tableau?
My name is Shin.
As many people in my generation are so, I was heavy MS excel user.
The skill itself is actually beneficial in my company.
In the past I tried to learn MS access, but not succeeded with technical difficulties I encountered.
2 years ago, I met Tableau and I became a fan of Tableau immediately.
The way I came to know Tableau was actually from info as Emerging Stock.
And I became interested in the service itself because it is said that the program is expanding their users through user-to-user communication.
Still struggling to develop Tableau skills, but all of trial and errors are fun for me.
Now my Tableau knowlege reached at a certain level which I can sahre with other people, then I will post Tips here from today.
Actully I'm already working on Tableau Community, then you may know me already..
Talking about Stock, I really purchased Tableau Stock. But just made loss. That's not from company's bad performance, but from my bad timing of buy/sell. : )